Matplotlib
diagrams


| Matplotlib | diagrams | |
|---|---|---|
| 1 | 110 | |
| 1 | 35,003 | |
| - | - | |
| 6.4 | 6.2 | |
| 5 months ago | 30 days ago | |
| Jupyter Notebook | Python | |
| - | MIT License |
Stars - the number of stars that a project has on GitHub. Growth - month over month growth in stars.
Activity is a relative number indicating how actively a project is being developed. Recent commits have higher weight than older ones.
For example, an activity of 9.0 indicates that a project is amongst the top 10% of the most actively developed projects that we are tracking.
Matplotlib
-
Mastering Matplotlib: A Step-by-Step Tutorial for Beginners
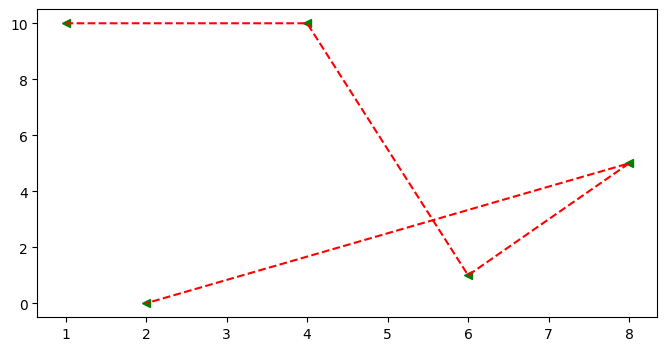 ## Scatter Graph * It similar to a line graph * Used to show how one variable is related to another * It consists of data points, if it is linear then it is highly correlated * It only marks the data point. * Syntax: plt.scatter(x,y) ### Parameter of Scatter Graph * c: Sets color of markers. * s: Sets the size of markers. * marker: Select a marker. e.g.: circle, triangle, etc * edgecolor: Sets the color of lines on the edges of markers. ```python x=[1,4,6,8,2] y=[10,10,1,5,0] fig = plt.figure(figsize=(8,4)) ax = fig.add_subplot() ax.scatter(x , y , c='red' , s=500 , marker='*' , edgecolor='blue' , label='scatter') ax.set_title('Scatter') ax.set_xlabel('X-Axis') ax.set_ylabel('Y-Axis') plt.legend()
diagrams
- Diagrams as Code
-
Mastering Matplotlib: A Step-by-Step Tutorial for Beginners
diagrams - Diagram as Code.
- How to draw beautiful software architecture diagrams
-
Top 9 Architecture diagram software for cloud infrastructure
Mingrammer is an intriguing tool for individuals who prefer coding diagrams rather than creating them through graphical interfaces. It operates using Python code and offers a relatively quick setup process. It is compatible with AWS, Azure, GCP, Alibaba, and Oracle. Notably, the project is open source and has garnered significant attention on GitHub with over 31K stars.
-
Pravljenje AWS strukturnog diagrama
Ja sam koristio ovo: https://diagrams.mingrammer.com/
-
Dynamically generate Cloud System Architecture diagram
That’s another option: https://diagrams.mingrammer.com Guessing with IaC done with Pulumi (Python) and this, it could pretty powerful and automatically generated.
- [Golang] Diagrammes comme code avec Go?
- Network diagram Tool
-
Top 7 diagrams as code tools for software architecture
Diagrams allow you to draw cloud system architectures using Python code.
-
Do you like to draw while explaining stuff?
I use excalidraw a lot for short conversations. If I have to go into major detail I use diagrams https://diagrams.mingrammer.com
What are some alternatives?
c4-draw.io - Draw.io template/diagram containing C4 Model shapes. Drawio Diagrams.net
Graphviz - Simple Python interface for Graphviz
obsidian-excalidraw-plugin - A plugin to edit and view Excalidraw drawings in Obsidian
pygraphviz - Python interface to Graphviz graph drawing package
excalidraw - Virtual whiteboard for sketching hand-drawn like diagrams
vscode-drawio - This unofficial extension integrates Draw.io (also known as diagrams.net) into VS Code.
mermaid - Generation of diagrams like flowcharts or sequence diagrams from text in a similar manner as markdown
plotly - The interactive graphing library for Python :sparkles: This project now includes Plotly Express!
Apache Superset - Apache Superset is a Data Visualization and Data Exploration Platform [Moved to: https://github.com/apache/superset]
matplotlib - matplotlib: plotting with Python
PyQtGraph - Fast data visualization and GUI tools for scientific / engineering applications
d2 - D2 is a modern diagram scripting language that turns text to diagrams.