Matplotlib
Matplotlib notes and examples (by mritunjaysri28)

bqplot
Plotting library for IPython/Jupyter notebooks [Moved to: https://github.com/bqplot/bqplot] (by bloomberg)


| Matplotlib | bqplot | |
|---|---|---|
| 1 | 1 | |
| 1 | 3,503 | |
| - | - | |
| 6.4 | 10.0 | |
| 5 months ago | 7 months ago | |
| Jupyter Notebook | TypeScript | |
| - | Apache License 2.0 |
The number of mentions indicates the total number of mentions that we've tracked plus the number of user suggested alternatives.
Stars - the number of stars that a project has on GitHub. Growth - month over month growth in stars.
Activity is a relative number indicating how actively a project is being developed. Recent commits have higher weight than older ones.
For example, an activity of 9.0 indicates that a project is amongst the top 10% of the most actively developed projects that we are tracking.
Matplotlib
Posts with mentions or reviews of Matplotlib.
We have used some of these posts to build our list of alternatives
and similar projects. The last one was on 2023-12-25.
-
Mastering Matplotlib: A Step-by-Step Tutorial for Beginners
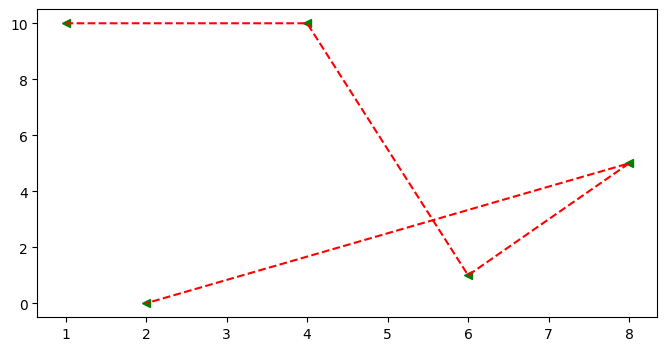 ## Scatter Graph * It similar to a line graph * Used to show how one variable is related to another * It consists of data points, if it is linear then it is highly correlated * It only marks the data point. * Syntax: plt.scatter(x,y) ### Parameter of Scatter Graph * c: Sets color of markers. * s: Sets the size of markers. * marker: Select a marker. e.g.: circle, triangle, etc * edgecolor: Sets the color of lines on the edges of markers. ```python x=[1,4,6,8,2] y=[10,10,1,5,0] fig = plt.figure(figsize=(8,4)) ax = fig.add_subplot() ax.scatter(x , y , c='red' , s=500 , marker='*' , edgecolor='blue' , label='scatter') ax.set_title('Scatter') ax.set_xlabel('X-Axis') ax.set_ylabel('Y-Axis') plt.legend()
bqplot
Posts with mentions or reviews of bqplot.
We have used some of these posts to build our list of alternatives
and similar projects. The last one was on 2023-12-25.
-
Mastering Matplotlib: A Step-by-Step Tutorial for Beginners
bqplot - Interactive Plotting Library for the Jupyter Notebook.