Get real-time insights from all types of time series data with InfluxDB. Ingest, query, and analyze billions of data points in real-time with unbounded cardinality. Learn more →
Top 3 matplotlib-style Open-Source Projects
-
InfluxDB
Power Real-Time Data Analytics at Scale. Get real-time insights from all types of time series data with InfluxDB. Ingest, query, and analyze billions of data points in real-time with unbounded cardinality.

Project mention: Lets-Plot: An open-source plotting library by JetBrains | news.ycombinator.com | 2023-07-15This seems quite similar to plotnine [0], which also provides a grammar of graphics interface for Python. That said, I love ggplot and I can't wait to use this in my research! I hope we can port/re-implement ggthemes, scientificplots [1], and other ggplot libraries for lets-plot.
0: https://plotnine.readthedocs.io/en/stable/
1: https://github.com/garrettj403/SciencePlots
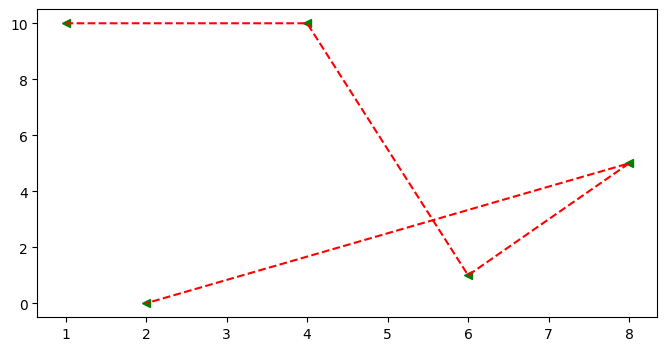 ## Scatter Graph * It similar to a line graph * Used to show how one variable is related to another * It consists of data points, if it is linear then it is highly correlated * It only marks the data point. * Syntax: plt.scatter(x,y) ### Parameter of Scatter Graph * c: Sets color of markers. * s: Sets the size of markers. * marker: Select a marker. e.g.: circle, triangle, etc * edgecolor: Sets the color of lines on the edges of markers. ```python x=[1,4,6,8,2] y=[10,10,1,5,0] fig = plt.figure(figsize=(8,4)) ax = fig.add_subplot() ax.scatter(x , y , c='red' , s=500 , marker='*' , edgecolor='blue' , label='scatter') ax.set_title('Scatter') ax.set_xlabel('X-Axis') ax.set_ylabel('Y-Axis') plt.legend()
NOTE:
The open source projects on this list are ordered by number of github stars.
The number of mentions indicates repo mentiontions in the last 12 Months or
since we started tracking (Dec 2020).
matplotlib-styles related posts
-
Matplotlib Styles for Scientific Plotting
-
Struggling with Python
-
Using Python (and matplotlib) for plotting in academia
-
[OC] Coinbase users over time
-
Matplotlib style library for Scientific plots
-
New clean matplotlib style, dufte
-
A note from our sponsor - InfluxDB
www.influxdata.com | 5 May 2024
Index
What are some of the best open-source matplotlib-style projects? This list will help you:
| Project | Stars | |
|---|---|---|
| 1 | SciencePlots | 6,471 |
| 2 | nord-deep-mpl-stylesheet | 7 |
| 3 | Matplotlib | 1 |

Sponsored
SaaSHub - Software Alternatives and Reviews
SaaSHub helps you find the best software and product alternatives
www.saashub.com