


Get real-time insights from all types of time series data with InfluxDB. Ingest, query, and analyze billions of data points in real-time with unbounded cardinality. Learn more →
Top 20 Histogram Open-Source Projects
-
InfluxDB
Power Real-Time Data Analytics at Scale. Get real-time insights from all types of time series data with InfluxDB. Ingest, query, and analyze billions of data points in real-time with unbounded cardinality.

-
FlexyPool
FlexyPool adds metrics and failover strategies to a given Connection Pool, allowing it to resize on demand.
-
rare
Realtime regex-extraction and aggregation into common CLI formats such as histograms, bar graphs, numerical summaries, tables, and more! (by zix99)
-
SaaSHub
SaaSHub - Software Alternatives and Reviews. SaaSHub helps you find the best software and product alternatives

-
-
-
-
Litrato
Android photo editing app with various filters and tools. Included advanced features like masking, histogram, color picker, EXIF viewer...
-
Nexogen.Libraries.Metrics
Library for collecting application metrics in .NET and exporting them to Prometheus
-
im2dhisteq
This module attempts to enhance contrast of a given image by equalizing its two dimensional histogram.
-
image-hdr
An implementation of HDR Radiance Estimation using Poisson Photon Noise Estimator for creating HDR image from a set of images
-
im2dhist
This small piece of code is intended to help researchers, especially in field of image processing, to easily calculate two dimensional histogram of a given image.
-
imhblpce
This module attempts to enhance contrast of a given image by employing a method called HBLPCE.
-
SaaSHub
SaaSHub - Software Alternatives and Reviews. SaaSHub helps you find the best software and product alternatives
Website: react-google-charts GitHub page
Project mention: Plotille: Plot in the terminal using Braille dots | news.ycombinator.com | 2024-05-04
If you tried it and now wondering what the heck is "rare" and how to get it installed: https://github.com/zix99/rare
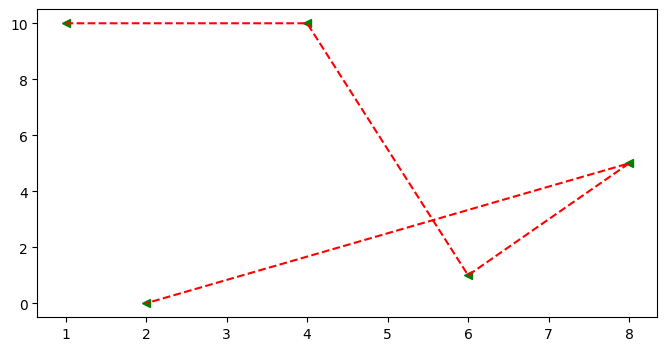 ## Scatter Graph * It similar to a line graph * Used to show how one variable is related to another * It consists of data points, if it is linear then it is highly correlated * It only marks the data point. * Syntax: plt.scatter(x,y) ### Parameter of Scatter Graph * c: Sets color of markers. * s: Sets the size of markers. * marker: Select a marker. e.g.: circle, triangle, etc * edgecolor: Sets the color of lines on the edges of markers. ```python x=[1,4,6,8,2] y=[10,10,1,5,0] fig = plt.figure(figsize=(8,4)) ax = fig.add_subplot() ax.scatter(x , y , c='red' , s=500 , marker='*' , edgecolor='blue' , label='scatter') ax.set_title('Scatter') ax.set_xlabel('X-Axis') ax.set_ylabel('Y-Axis') plt.legend()
NOTE:
The open source projects on this list are ordered by number of github stars.
The number of mentions indicates repo mentiontions in the last 12 Months or
since we started tracking (Dec 2020).
Histogram related posts
-
Scalable Sequence for PostgreSQL
-
Go Image Processing
-
Histogramming libraries for Python updated (boost-histogram / Hist)
-
Lib advice
-
Using numba, my code now runs faster by about 20 times 😲
-
Using numba my code runs faster by about 20 times 😲
-
Enhance Images From 💩 to 🔥
-
A note from our sponsor - InfluxDB
www.influxdata.com | 6 May 2024
Index
What are some of the best open-source Histogram projects? This list will help you:
| Project | Stars | |
|---|---|---|
| 1 | bild | 3,917 |
| 2 | react-google-charts | 1,556 |
| 3 | FlexyPool | 1,048 |
| 4 | plotlib | 460 |
| 5 | color-matcher | 343 |
| 6 | plotille | 287 |
| 7 | rare | 253 |
| 8 | boost-histogram | 138 |
| 9 | hist | 122 |
| 10 | chaperon | 119 |
| 11 | Litrato | 81 |
| 12 | Nexogen.Libraries.Metrics | 61 |
| 13 | torchist | 47 |
| 14 | im2dhisteq | 24 |
| 15 | WhyzaGC | 20 |
| 16 | image-hdr | 17 |
| 17 | im2dhist | 6 |
| 18 | imhblpce | 5 |
| 19 | machination | 3 |
| 20 | Matplotlib | 1 |
Sponsored
SaaSHub - Software Alternatives and Reviews
SaaSHub helps you find the best software and product alternatives
www.saashub.com