Our great sponsors
-
webpack
A bundler for javascript and friends. Packs many modules into a few bundled assets. Code Splitting allows for loading parts of the application on demand. Through "loaders", modules can be CommonJs, AMD, ES6 modules, CSS, Images, JSON, Coffeescript, LESS, ... and your custom stuff.
- A valid
robots.txtfile - A valid
rel=cannonicalattribute - Correct aspect ratio for images
- Using HTTP/2 for all resources
- Using HTTPS to serve the site
- Not using deprecated browser APIs
- Page load should be fast even on mobile networks
- Use HTTPS to serve the website
- Registers a service worker that controls page and
start_url - The web app manifest meets the installability requirements
-
SurveyJS
Open-Source JSON Form Builder to Create Dynamic Forms Right in Your App. With SurveyJS form UI libraries, you can build and style forms in a fully-integrated drag & drop form builder, render them in your JS app, and store form submission data in any backend, inc. PHP, ASP.NET Core, and Node.js.

A valid element
There's plenty more audits that fall within the scope of this score. To read the full list, check out this article.
7. Best Practices Score
The Lighthouse Best Practices score tells you about the code health of your web page. As with all other scores, it also shows you opportunities to improve the health of your site.
It's a weighted average, in which 0 is the lowest score and 100 the highest (better), and includes various technical audits such as:
To read all audits included in this score, read this article by the Lighthouse team.
8. PWA Score
The Lighthouse PWA score tells you if your site is compatible with the requirements for a Progressive Web App. At a high level, that means it should be fast, reliable and installable.
It's a weighted average, in which 0 is the lowest score and 100 the highest (better), and includes various technical audits such as:
You can find the rest of the audits for this score in this article.
Page Load Metrics
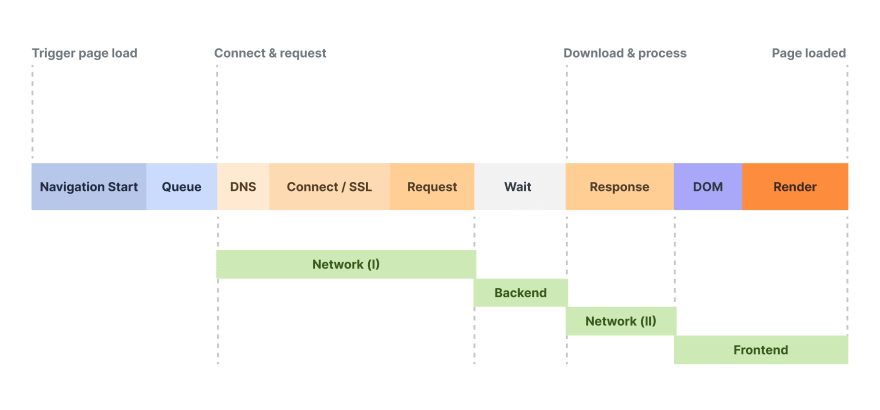
When you click a link, your web browser starts a multi-step process to load all synchronous resources required for this web page. The longer this process takes, the longer you must wait to interact with a website.
A simplified page load time process.How long this process takes is what the Page Load Time measures. It involves multiple steps, and can be broken into multiple parts such as DNS lookup time, SSL/TLS, download size and many more.
Let's look into each one individually.
9. Page Load Time
Page load time measures the amount of time it takes for a complete web page to show up on your screen.
It's measured from the point a user initiates it - such as clicking on a link or typing the website URL - to when the page has fully loaded in the browser.
Various page load time measurements in Panelbear10. Domain Lookup Time
The Domain Lookup Time is the time spent resolving the server address for a given domain.
For example, when you type
google.comyour browser must first resolve that domain name into an IP address (the server which will serve the page HTML for our request). The duration of this process is what this metric measures.11. Server Connection Time
Once the browser has resolved the domain name into an IP address, it now needs to connect to the web server. The Server Connection Time measures how long it took to establish a TCP connection to the server.
12. Establish SSL/TLS Time
Transport Layer Security (TLS) is an encryption protocol designed to secure communications over the Internet.
Establish SSL/TLS Time measures how long it takes to perform a TLS handshake. During a TLS handshake, the two sides exchange messages to acknowledge and verify each other, establish which encryption algorithm will be used, and agree on session keys.
This process is a foundational part of how HTTPS works, and is vital to ensure privacy and security while you browse the web.
Various network timings in Panelbear.13. Time to First Byte (TTFB)
Time to First Byte (TTFB) is how long it takes from when a browser requests a page to when it receives the first byte of information from the server. This usually includes the time spent on DNS lookup, establishing the TCP connection, and the SSL/TLS handshake if the request was made over HTTPS.
It's a good metric to approximate the performance of a backend server, from the perspective of the end user.
Inspecting the median TTFB for a website.Why is this metric important?
If you measure the response time of your server from the server itself, you would only account for the time your server spent processing the request. In other words, the journey from your server to the user's browser would be unaccounted for.
For example, say you are located in California and your server is located in an AWS data center in North Virginia. You measure your TTFB and you're happy to see a result of 25 ms. However, when a user from the EU or Australia opens your website, the TTFB is now 200-500 ms.
The conclusion here might be that no matter if you scale your servers vertically or horizontally, the real issue is that the server is too far away from the end users. So you probably want to deploy servers in those regions too - assuming it makes sense for your product or business.
14. HTML Download Time
HTML Download Time measures the time it takes to download the initial document for a website. This document normally references various other resources (images, stylesheets, scripts) which are queued for download too.
15. Render Time
The Render Time measures how long it takes for the browser to paint the HTML document after downloading and parsing. This can vary a lot as it highly depends on the complexity of your site and the performance capabilities of the users device (eg. some mobile devices can take longer to render a complex website vs a powerful development machine).
16. Request Count
The Request Count refers to the number of resources required to load a web page. The impact of this metric on end user experience is highly dependent on other factors too.
For example, if you have a website which requires 50 requests to load but most of them are small resources which do not block rendering, it may not negatively impact how the user interacts with the site.
On the other hand, if you have a web page which requires a single request to load, but that request takes 10 seconds to complete and loads several megabytes of data, it's likely the user will abandon the site before the request completes.
As with most other metrics, it's useful to measure request count in relation to the other characteristics of your web page.
17. Transfer Size
Transfer Size measures the total size of all assets transferred during page load. This includes every request for HTML, images, stylesheets, scripts, and JSON documents.
It's a good measurement of how heavy your web page is.
18. HTML Transfer Size
The HTML Transfer Size tells you the size of all HTML assets transferred on page load.
19. Image Transfer Size
The Image Transfer Size tells you the size of all image assets transferred during page load.
The following are examples of common image assets:
Format name Extension MIME type Graphics Interchange Format (GIF) .gif image/gif Web Picture format (WEBP) .webp image/webp Portable Network Graphics (PNG) .png image/png AV1 Image File Format (AVIF) .avif image/avif Joint Photographic Expert Group image (JPEG) .jpeg, .jpg image/jpeg Scalable Vector Graphics (SVG) .svg image/svg+xml20. CSS Transfer Size
CSS Transfer Size measures the total size of all stylesheet (CSS) assets transferred during page load.
21. Font Transfer Size
The Font Transfer Size tells you the size of all font assets transferred during page load.
The following are examples of font assets:
Format name Extension MIME type TrueType .ttf font/ttf Web Open Font Format .woff, .woff2 font/woff, font/woff2 OpenType .otf font/otf22. Javascript Transfer Size
The Javascript Transfer Size measures the total size of all Javascript (JS) assets transferred during page load.
For many modern web apps, this asset type has become a considerable chunk of the page load process. Large Javascript files may not only lead to longer download times, but also increase the time the browser needs to parse and render the site. This can negatively affect how long it takes for the site to become interactive too.
In order to improve load times, many applications now rely on techniques such as tree shaking (automatically remove unused code), asset bundling (package related assets together) and code splitting (split files and only load as required for specific pages). A popular tool for these purposes is Webpack.
23. JSON Transfer Size
JSON Transfer Size measures the total size of all JSON assets transferred during page load.
24. Video Transfer Size
Video Transfer Size measures the total size of all video assets transferred during page load.
Here are some examples of common video assets:
Format name Extension MIME type WebM .webm video/webm Ogg .ogg video/ogg MPEG-4 .mp4 video/mp4 iPhone Index .m3u8 application/x-mpegURL iPhone Segment .ts video/MP2T Flash .flv video/x-flv 3GP Mobile .3gp video/3gpp QuickTime .mov video/quicktime A/V Interleave .avi video/x-msvideo Windows Media .wmv video/x-ms-wmv25. Javascript Error Count
The Javascript Error Count tells you how many runtime errors the browser encountered while loading your web page.
While on its own it's not enough to troubleshoot and debug errors, it's very helpful to track this metric in aggregate to ensure no deployments or configuration changes cause unintended issues during runtime.
This metric is most useful when monitored in conjunction with error tracking software. That way, if the total error count goes beyond your tolerance threshold, your team would be able to troubleshoot the issue by inspecting the reported stack traces, and breadcrumbs to understand why the issue happened and fix it early.
In Conclusion
As previously mentioned, a faster website not only helps deliver a great user experience, but can also significantly boost your conversion rate and sales.
Monitoring your website's performance over time is more important than ever in order to prevent unintended consequences when deploying bug fixes, adding third party scripts and making improvements to the site.
That way you can make changes with confidence that you're not breaking stuff without realizing, and ensuring you always deliver a great experience on your website.
I hope this guide comes useful to you. Also, be sure to check out my guide on website monitoring tools for various alternative tools you can use to monitor your frontend applications.